Remote Sensing - Lab 7: Photogrammetry
Goal and Background
The goal of this lab exercise is to become familiar with performing key photogrammetric tasks on aerial photographs and satellite images. Tasks include performing Stereoscopy and performing Orthorectification on satellite images. Completing this lab exercise will help to gain an understanding of the mathematics behind the calculation of photographic scales, measurement of areas and perimeters, and calculating relief displacement.
Lab 7 is split into three parts; (1) Scales, Measurements and Relief Displacements, (2) Stereoscopy, and (3) Orthorectification. Each of these parts are outlined in the Methods and Results sections of this blog post.
Methods
The methods used to obtain the results for each of the three parts of this lab exercise are outlined below. The data sources used for each part are listed in the Sources section of this blog post.
Scales, Measurements and Relief Displacements
Calculating Scale:
If the actual distance between two points on an image is known, scale can be calculated by taking a measurement on the image between two said points. In this case, the distance between points A and B in Image 1.1 below is 8,822.47 ft. The distance between the two points on the screen is taken using a ruler and is 3 inches. Converting the actual distance measurement to inches allows the scale to be calculated, which is 1:35,290 for this image.
 |
| Image 1.1. Satellite Image of Eau Claire, WI with measured distance between points A and B |
Scale can also be calculated if the focal length of the camera is known, as well as the height above ground that the image was taken at. Scale = Focal Length / Height Above Ground.
Calculating Area:
The area of an image can be calculated using the Polygon Measure tool in Erdas Imagine. Adding points around the perimeter of the surface feature to be measured will create a polygon, seen around the lagoon being measured in Image 1.2.
 |
| Image 1.2. Measuring area with the Polygon Measure tool |
Similarly, a surface features perimeter can be measured using the Polyline Measure tool.
Calculating Relief Displacement:
Tall objects that are away from the principal point of an aerial photo will appear to be tilted because they are not directly below the camera. In order to correct this tilt in the image, relief displacement needs to be calculated. Relief displacement can be calculated with the following equation:
Displacement = (Height of Object x Distance from Principal Point to Top of Object) / Height of Camera
Stereoscopy
Stereoscopy is used to generate a 3D image using an elevation model. In this section of the lab exercise, a 3D image will be created using both a Digital Elevation Model (DEM) and a LiDAR Derived Surface Model (DSM).
Creation of Anaglyph Image with the Use of a Digital Elevation Model (DEM)
- In Erdas Imagine, open the image of Eau Claire (ec_city.img) in one viewer and the DEM image (ec_dem2.img) in another viewer
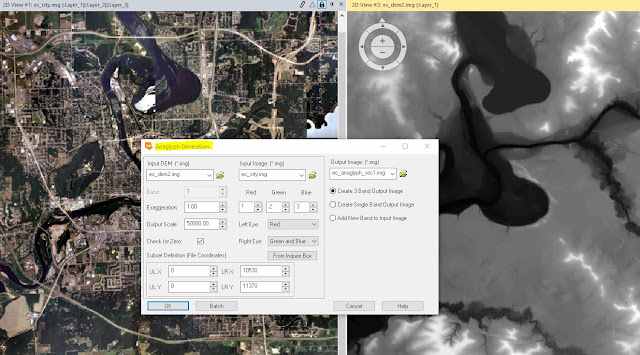
- Run the Anaglyph Generation tool, as seen in Image 2.1
 |
| Image 2.1. Anaglyph Generation tool used with a DEM image |
Using a pair of polaroid glasses to observe the output image, the elevation features in Eau Claire become more apparent when analyzing the image. One of the features that stands out most is the Putnam Park hill that runs from the UWEC campus and circles around the Third Ward neighborhood.
Creation of Anaglyph Image with the Use of a LiDAR Derived Surface Model (DSM)
- In Erdas Imagine, open the image of Eau Claire (ec_claire_quad.img) in one viewer and the DSM image (ec_dsm2m.img) in another viewer
- Run the Anaglyph Generation tool, as seen in Image 2.2
 |
| Image 2.2. Anaglyph Generation tool for a DSM |
Orthorectification
This section of the lab exercise introduces the Erdas Imagine Lecia Photogrammetric Suite (LPS). The LPS has a variety of uses, including digital photogrammetry for triangulation, orthorectification of images collected by various sensors, and extraction of digital surface and elevation models. In this section, LPS will be used to orthorectify images and create a planimetrically true orthoimage.
The following steps were taken to orthorectify images:
Create a New Project:
Create a new project by clicking the Toolbox tab and open IMAGINE Photogrammetry. Create a new Block File and set up the projection as seen below in Image 3.1.
 |
| Image 3.1. New Block File - Projection Chooser dialog |
Add Imagery to the Block and Define Sensor Model:
Add a SPOT pan frame to the Block and verify the parameters of the SPOT Pushbroom sensor in the dialog seen in Image 3.2.
 |
| Image 3.2. SPOT Pushbroom Frame Editor |
Activate Point Measurement Tool and Collect GCPs:
- Use the Point Measurement tool to establish reference coordinates, as seen in Image 3.3. 9 GCPs will be created in this step.
 |
| Image 3.3. Establish GCPs with Point Measurement tool |
- For the final two GCPs, change the horizontal reference image to use an orthoimage (napp_2m-ortho.img)
- Set the Vertical Reference Source and collect elevation information for all GCPs by using a DEM
Set Type and Usage, Add a 2nd Image to the Block & Collect its GCPs:
- Add a second image to the Block File and open the Classic Point Measurement tool again to collect GCPs on this new image
- After collecting matching GCPs on the second image, the block image interface should now include those GCPs that overlap in the yellow area, and the GCPs unique to the first image in gray (Image 3.4)
 |
| Image 3.4. Block Image Interface with two overlapping images |
Automatic Tie Point Collection, Triangulation, and Ortho Resample:
Complete the Orthorectification process of the two images in the Block File by using the Tie Point Collection process to measure the image coordinate positions of the ground points appearing in the overlap area of the two SPOT images.
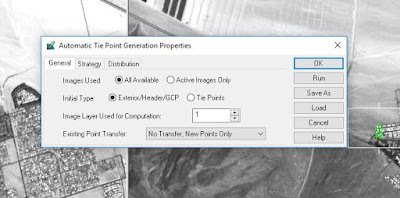
Run the Automatic Tie Point Generation tool from the Point Measurement tool palette. See Image 3.5 for the dialog selections.
 |
| Image 3.5. Automatic Tie Point Generation Properties dialog |
After all control and tie points have been collected, it is time to perform triangulation. Triangulation will establish the mathematical relationship between the images in the block file, the sensor model, and the ground.
Run the Triangulation tool and view the Report from the Triangulation Summary seen in Image 3.6.
 |
| Image 3.6. Triangulation tool and Triangulation Summary dialog |
 |
| Image 3.7. Ortho Resampling Process |
Results
This section highlights the results found for each part of the lab exercise; (1) Scales, Measurements and Relief Displacements, (2) Stereoscopy, and (3) Orthorectification.
Scales, Measurements and Relief Displacements
Calculating Scale:
Using the known real-world distance between points A and B (8,822.47 ft), the scale is able to be calculated by measuring the same distance in the photo using a ruler. In this image, that distance was 3 inches (See Image 4.1). Using these numbers, the scale is calculated to be 1:35,290.
 |
| Image 4.1. Measured distance between points A and B = 3 inches |
Calculating Area and Perimeter:
Use the Polygon Measure tool to measure the area of a surface feature and the Polyline Measure tool to measure the perimeter of a surface feature. These tools were used to measure area and perimeter of the lagoon near Eau Claire in Image 4.2.
 |
| Image 4.2. Lagoon near Eau Claire, WI measured with Polygon and Polyline Measure tools |
Area: 93.4 acres
Perimeter: 2.5 miles
Calculating Relief Displacement:
Using the formula noted in the Methods section, the relief displacement of Tower A in Image 4.3 is 0.22 inches.
 |
| Image 4.3. Height of Tower A and distance to Principal Point used to calculate Relief Displacement |
Stereoscopy
Creation of Anaglyph Image with the Use of a Digital Elevation Model (DEM)
The combination of the Eau Claire city image and the DEM creates an anaglyph image that highlights the elevation changes. The elevation features become visible when the image is observed with polaroid glasses.
Creation of Anaglyph Image with the Use of a LiDAR Derived Surface Model (DSM)
When comparing the output anaglyph of the DSM to the anaglyph of the DEM, the elevation changes appear to be more visible with the LiDAR DSM output. Smaller elevation changes begin to stand out and even larger buildings appear to be three dimensional. When viewing the anaglyph image without polaroid glasses, the image appears to be quite blurry. This is especially true in the highlighted area of Image 5.1. When viewed with the polaroid glasses, however, the blurriness disappears and the elevation changes become much more apparent.
 |
| Image 5.1. DSM Derived Anaglyph Image |
Orthorectification
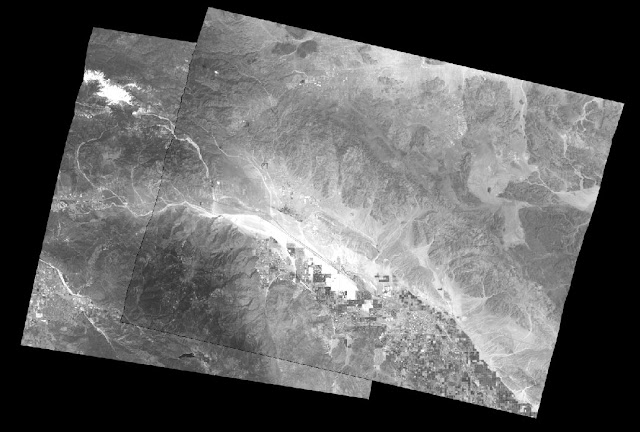
Through the process of orthorectification, the two original SPOT images were paired together to create a planimetrically true orthoimage, which can be seen below in Image 6.1.
GCPs were first established on a single SPOT image using another reference image. After the first set of GCPs were created, the second SPOT image was introduced and was tied to the first through matching GCPs that already existed from the first image. Next came the finishing steps of Tie Point Generation, Triangulation, and Ortho Resampling. Once these steps were completed, the final output was a planimetrically true orthoimage that displays the surface features in their real-world X and Y positions. Image 6.2 is zoomed in to the boundary between the two SPOT images in the final output orthoimage. Notice how seamless the transition is from one image to the other.
 |
| Image 6.1. Final output of two orthorectified images |
GCPs were first established on a single SPOT image using another reference image. After the first set of GCPs were created, the second SPOT image was introduced and was tied to the first through matching GCPs that already existed from the first image. Next came the finishing steps of Tie Point Generation, Triangulation, and Ortho Resampling. Once these steps were completed, the final output was a planimetrically true orthoimage that displays the surface features in their real-world X and Y positions. Image 6.2 is zoomed in to the boundary between the two SPOT images in the final output orthoimage. Notice how seamless the transition is from one image to the other.
 |
| Image 6.2. Zoomed to boundary of orthorectified output image |
Sources
National Agriculture Imagery Program (NAIP) images courtesy of U.S. Department of Agriculture (2005). Retrieved on April 29, 2018
Digital Elevation Model (DEM) of Eau Claire, WI courtesy of U.S. Department of Agriculture Natural Resources Conservation Service (2010). Retrieved on April 29, 2018.
LiDAR-Derived Surface Model (DSM) for sections of Eau Claire and Chippewa courtesy of Eau Claire County and Chippewa County governments respectively (Date unknown). Retrieved on April 29, 2018.
Spot Satellite Images courtesy of Erdas Imagine (2009). Retrieved on April 29, 2018.
Digital Elevation Model (DEM) for Palm Springs, CA courtesy of Erdas Imagine (2009). Retrieved on April 29, 2018.
National Aerial Photography Program (NAPP) 2 meter images courtesy of Erdas Imagine (2009). Retrieved on April 29, 2018.


Comments
Post a Comment